KMeans benchmarks
Inspect fitting, prediction and explicit local CPU workers alongside the numerical corrections that define the new serial baseline.
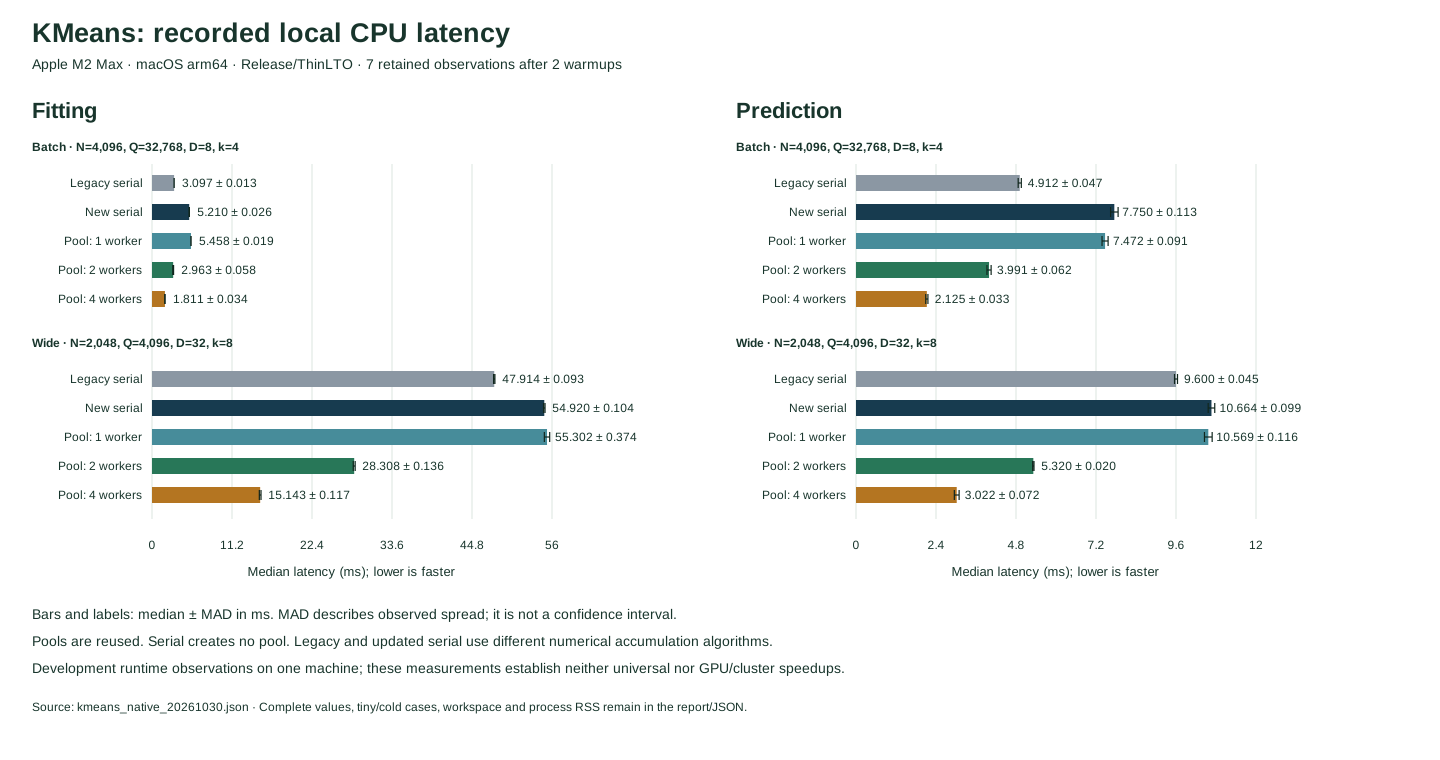
For Batch, four reused workers take 1.8106 ms to fit versus 5.2096 ms for corrected serial (2.88×). Prediction takes 2.1249 ms versus 7.7500 ms (3.65×). These speedups divide corrected serial time by four-worker time; the tables also preserve the legacy serial measurements.
The corrected implementation's serial path costs more here: Batch corrected serial takes 1.68× the legacy fit time and 1.58× the legacy prediction time. Legacy serial measured 3.0969 ms for fit and 4.9125 ms for prediction. The four-worker before-and-after speedups are 1.71× and 2.31× respectively; these overall ratios differ from same-output worker scaling.
Numerical corrections can change centers, inertia, assignments and stopping behavior relative to legacy KMeans. A before-and-after timing is therefore a comparison of implementations on the declared workload. Same-output parallel scaling compares corrected serial with the corrected worker paths.
Follow the complete comparison.
Switch between fitting and prediction. Each worker bar uses the same corrected arithmetic; the legacy implementation remains a separate before-and-after reference.
Batch · Fit · N=4,096, Q=32,768, D=8, clusters=4. Reused local CPU pools.
- Corrected arithmetic
- Legacy serial: results may differ
Fit latency
Median call time · lower is faster
Worker speedup
Corrected serial median ÷ worker median
Charged workspace
Checked operation admission · lower is smaller
Process peak RSS
Fresh-process lifetime high-water mark
Corrected serial and admitted 1, 2 and 4 worker runs are checked bitwise in the same build and floating-point environment. Full tables below retain repetitions, stopping state and cold-pool costs.
Fitting with corrected arithmetic
The fit timer includes initialization, Lloyd assignment and mean updates, final assignments, inertia and fitted-state construction. Input preparation and independent verification are outside that timer. Reused contexts exist before the call. Completed iterations and convergence flags remain visible because a faster run that performs a different number of updates needs that context.
Batch
N=4,096, Q=32,768, D=8, clusters=4, iteration cap=20, seed=42, synthetic distribution=balanced.
| Metric | Legacy serial | Corrected serial | 1 worker | 2 workers | 4 workers |
|---|---|---|---|---|---|
| Median ± MAD (ms) | 3.0969 ± 0.013000 | 5.2096 ± 0.026251 | 5.4577 ± 0.018959 | 2.9627 ± 0.058334 | 1.8106 ± 0.033833 |
| Repetitions | 7 | 7 | 7 | 7 | 7 |
| Corrected serial ÷ time | 1.68× | 1.00× | 0.95× | 1.76× | 2.88× |
| Reused 1 worker ÷ time | 1.76× | 1.05× | 1.00× | 1.84× | 3.01× |
| Legacy serial ÷ time | 1.00× | 0.59× | 0.57× | 1.05× | 1.71× |
| Completed iterations | 4 | 4 | 4 | 4 | 4 |
| Converged | true | true | true | true | true |
Wide
N=2,048, Q=4,096, D=32, clusters=8, iteration cap=20, seed=42, synthetic distribution=balanced.
| Metric | Legacy serial | Corrected serial | 1 worker | 2 workers | 4 workers |
|---|---|---|---|---|---|
| Median ± MAD (ms) | 47.914 ± 0.092793 | 54.920 ± 0.10413 | 55.302 ± 0.37437 | 28.308 ± 0.13550 | 15.143 ± 0.11738 |
| Repetitions | 7 | 7 | 7 | 7 | 7 |
| Corrected serial ÷ time | 1.15× | 1.00× | 0.99× | 1.94× | 3.63× |
| Reused 1 worker ÷ time | 1.15× | 1.01× | 1.00× | 1.95× | 3.65× |
| Legacy serial ÷ time | 1.00× | 0.87× | 0.87× | 1.69× | 3.16× |
| Completed iterations | 9 | 9 | 9 | 9 | 9 |
| Converged | true | true | true | true | true |
Prediction against fitted centers
Prediction timings exclude model fitting. Corrected serial and worker predictions use the same corrected fitted centers. Legacy prediction uses the legacy fitted model, whose centers can differ after the numerical corrections. Prediction still compares every query with every center; workers divide rows without changing the nearest-center tie rule.
Batch
N=4,096, Q=32,768, D=8, clusters=4, iteration cap=20, seed=42, synthetic distribution=balanced.
| Metric | Legacy serial | Corrected serial | 1 worker | 2 workers | 4 workers |
|---|---|---|---|---|---|
| Median ± MAD (ms) | 4.9125 ± 0.047125 | 7.7500 ± 0.11292 | 7.4720 ± 0.091000 | 3.9915 ± 0.062375 | 2.1249 ± 0.032582 |
| Repetitions | 7 | 7 | 7 | 7 | 7 |
| Corrected serial ÷ time | 1.58× | 1.00× | 1.04× | 1.94× | 3.65× |
| Reused 1 worker ÷ time | 1.52× | 0.96× | 1.00× | 1.87× | 3.52× |
| Legacy serial ÷ time | 1.00× | 0.63× | 0.66× | 1.23× | 2.31× |
Wide
N=2,048, Q=4,096, D=32, clusters=8, iteration cap=20, seed=42, synthetic distribution=balanced.
| Metric | Legacy serial | Corrected serial | 1 worker | 2 workers | 4 workers |
|---|---|---|---|---|---|
| Median ± MAD (ms) | 9.6002 ± 0.045041 | 10.664 ± 0.098584 | 10.569 ± 0.11571 | 5.3197 ± 0.020249 | 3.0217 ± 0.071792 |
| Repetitions | 7 | 7 | 7 | 7 | 7 |
| Corrected serial ÷ time | 1.11× | 1.00× | 1.01× | 2.00× | 3.53× |
| Reused 1 worker ÷ time | 1.10× | 0.99× | 1.00× | 1.99× | 3.50× |
| Legacy serial ÷ time | 1.00× | 0.90× | 0.91× | 1.80× | 3.18× |
Small calls, more centers and iteration limits
All measured workloads remain available, including calls for which pool overhead can dominate. These are deterministic synthetic numerical workloads, not a measurement of clustering quality on a scientific dataset. They expose dimensions, cluster count, seed and iteration cap. These elapsed-time observations stay within the existing work limits; requesting more workers does not increase those limits.
Tiny · N=32, D=4, clusters=2
N=32, Q=1, D=4, clusters=2, iteration cap=20, seed=42, synthetic distribution=balanced.
| Metric | Legacy serial | Corrected serial | 1 worker | 2 workers | 4 workers |
|---|---|---|---|---|---|
| Median ± MAD (ms) | 0.0047500 ± 0.000084000 | 0.014416 ± 0.00041700 | 0.064041 ± 0.0044590 | 0.079000 ± 0.017125 | 0.16233 ± 0.011958 |
| Repetitions | 7 | 7 | 7 | 7 | 7 |
| Corrected serial ÷ time | 3.03× | 1.00× | 0.23× | 0.18× | 0.09× |
| Reused 1 worker ÷ time | 13.48× | 4.44× | 1.00× | 0.81× | 0.39× |
| Legacy serial ÷ time | 1.00× | 0.33× | 0.07× | 0.06× | 0.03× |
| Completed iterations | 3 | 3 | 3 | 3 | 3 |
| Converged | true | true | true | true | true |
| Metric | Legacy serial | Corrected serial | 1 worker | 2 workers | 4 workers |
|---|---|---|---|---|---|
| Median ± MAD (ms) | 0.00012500 ± 0.0000 | 0.00020900 ± 0.0000010000 | 0.0078750 ± 0.00054100 | 0.0062910 ± 0.0010430 | 0.012750 ± 0.0060830 |
| Repetitions | 7 | 7 | 7 | 7 | 7 |
| Corrected serial ÷ time | 1.67× | 1.00× | 0.03× | 0.03× | 0.02× |
| Reused 1 worker ÷ time | 63.00× | 37.68× | 1.00× | 1.25× | 0.62× |
| Legacy serial ÷ time | 1.00× | 0.60× | 0.02× | 0.02× | 0.01× |
Larger · N=8192, D=16, clusters=16
N=8,192, Q=32,768, D=16, clusters=16, iteration cap=20, seed=42, synthetic distribution=balanced.
| Metric | Legacy serial | Corrected serial | 1 worker | 2 workers | 4 workers |
|---|---|---|---|---|---|
| Median ± MAD (ms) | 286.27 ± 1.0055 | 339.64 ± 0.76033 | 341.58 ± 0.33842 | 172.62 ± 0.23583 | 93.825 ± 1.2396 |
| Repetitions | 7 | 7 | 7 | 7 | 7 |
| Corrected serial ÷ time | 1.19× | 1.00× | 0.99× | 1.97× | 3.62× |
| Reused 1 worker ÷ time | 1.19× | 1.01× | 1.00× | 1.98× | 3.64× |
| Legacy serial ÷ time | 1.00× | 0.84× | 0.84× | 1.66× | 3.05× |
| Completed iterations | 20 | 20 | 20 | 20 | 20 |
| Converged | false | false | false | false | false |
| Metric | Legacy serial | Corrected serial | 1 worker | 2 workers | 4 workers |
|---|---|---|---|---|---|
| Median ± MAD (ms) | 53.502 ± 0.34708 | 63.009 ± 0.18367 | 62.751 ± 0.15792 | 31.806 ± 0.095209 | 16.070 ± 0.048916 |
| Repetitions | 7 | 7 | 7 | 7 | 7 |
| Corrected serial ÷ time | 1.18× | 1.00× | 1.00× | 1.98× | 3.92× |
| Reused 1 worker ÷ time | 1.17× | 1.00× | 1.00× | 1.97× | 3.90× |
| Legacy serial ÷ time | 1.00× | 0.85× | 0.85× | 1.68× | 3.33× |
Many clusters · N=4096, D=8, clusters=32
N=4,096, Q=8,192, D=8, clusters=32, iteration cap=20, seed=42, synthetic distribution=balanced.
| Metric | Legacy serial | Corrected serial | 1 worker | 2 workers | 4 workers |
|---|---|---|---|---|---|
| Median ± MAD (ms) | 65.373 ± 0.19421 | 92.461 ± 0.13379 | 93.638 ± 0.13983 | 47.480 ± 0.10054 | 28.646 ± 1.4981 |
| Repetitions | 7 | 7 | 7 | 7 | 7 |
| Corrected serial ÷ time | 1.41× | 1.00× | 0.99× | 1.95× | 3.23× |
| Reused 1 worker ÷ time | 1.43× | 1.01× | 1.00× | 1.97× | 3.27× |
| Legacy serial ÷ time | 1.00× | 0.71× | 0.70× | 1.38× | 2.28× |
| Completed iterations | 13 | 13 | 13 | 13 | 13 |
| Converged | true | true | true | true | true |
| Metric | Legacy serial | Corrected serial | 1 worker | 2 workers | 4 workers |
|---|---|---|---|---|---|
| Median ± MAD (ms) | 9.3179 ± 0.0073340 | 12.852 ± 0.032833 | 12.828 ± 0.063625 | 6.5280 ± 0.051250 | 3.6421 ± 0.082417 |
| Repetitions | 7 | 7 | 7 | 7 | 7 |
| Corrected serial ÷ time | 1.38× | 1.00× | 1.00× | 1.97× | 3.53× |
| Reused 1 worker ÷ time | 1.38× | 1.00× | 1.00× | 1.97× | 3.52× |
| Legacy serial ÷ time | 1.00× | 0.73× | 0.73× | 1.43× | 2.56× |
Every row a center · N=128, D=4, clusters=128
N=128, Q=4,096, D=4, clusters=128, iteration cap=10, seed=42, synthetic distribution=balanced.
| Metric | Legacy serial | Corrected serial | 1 worker | 2 workers | 4 workers |
|---|---|---|---|---|---|
| Median ± MAD (ms) | 0.41604 ± 0.0032930 | 0.68217 ± 0.00087600 | 0.74246 ± 0.0029590 | 0.39063 ± 0.0031250 | 0.30892 ± 0.0094590 |
| Repetitions | 7 | 7 | 7 | 7 | 7 |
| Corrected serial ÷ time | 1.64× | 1.00× | 0.92× | 1.75× | 2.21× |
| Reused 1 worker ÷ time | 1.78× | 1.09× | 1.00× | 1.90× | 2.40× |
| Legacy serial ÷ time | 1.00× | 0.61× | 0.56× | 1.07× | 1.35× |
| Completed iterations | 1 | 1 | 1 | 1 | 1 |
| Converged | true | true | true | true | true |
| Metric | Legacy serial | Corrected serial | 1 worker | 2 workers | 4 workers |
|---|---|---|---|---|---|
| Median ± MAD (ms) | 6.5955 ± 0.0086670 | 8.3446 ± 0.066875 | 8.3009 ± 0.013125 | 4.1979 ± 0.030500 | 2.3080 ± 0.090167 |
| Repetitions | 7 | 7 | 7 | 7 | 7 |
| Corrected serial ÷ time | 1.27× | 1.00× | 1.01× | 1.99× | 3.62× |
| Reused 1 worker ÷ time | 1.26× | 0.99× | 1.00× | 1.98× | 3.60× |
| Legacy serial ÷ time | 1.00× | 0.79× | 0.79× | 1.57× | 2.86× |
Overlapping batch · N=4096, D=8, clusters=4
N=4,096, Q=32,768, D=8, clusters=4, iteration cap=20, seed=42, synthetic distribution=overlap.
| Metric | Legacy serial | Corrected serial | 1 worker | 2 workers | 4 workers |
|---|---|---|---|---|---|
| Median ± MAD (ms) | 6.2575 ± 0.054042 | 11.457 ± 0.049375 | 11.821 ± 0.034041 | 6.4126 ± 0.15737 | 4.0386 ± 0.15683 |
| Repetitions | 7 | 7 | 7 | 7 | 7 |
| Corrected serial ÷ time | 1.83× | 1.00× | 0.97× | 1.79× | 2.84× |
| Reused 1 worker ÷ time | 1.89× | 1.03× | 1.00× | 1.84× | 2.93× |
| Legacy serial ÷ time | 1.00× | 0.55× | 0.53× | 0.98× | 1.55× |
| Completed iterations | 9 | 9 | 9 | 9 | 9 |
| Converged | true | true | true | true | true |
| Metric | Legacy serial | Corrected serial | 1 worker | 2 workers | 4 workers |
|---|---|---|---|---|---|
| Median ± MAD (ms) | 4.8536 ± 0.021875 | 7.6184 ± 0.019709 | 7.6230 ± 0.060792 | 3.9058 ± 0.0065830 | 2.4747 ± 0.12113 |
| Repetitions | 7 | 7 | 7 | 7 | 7 |
| Corrected serial ÷ time | 1.57× | 1.00× | 1.00× | 1.95× | 3.08× |
| Reused 1 worker ÷ time | 1.57× | 1.00× | 1.00× | 1.95× | 3.08× |
| Legacy serial ÷ time | 1.00× | 0.64× | 0.64× | 1.24× | 1.96× |
Skewed batch · N=4096, D=8, clusters=4
N=4,096, Q=32,768, D=8, clusters=4, iteration cap=20, seed=42, synthetic distribution=skew.
| Metric | Legacy serial | Corrected serial | 1 worker | 2 workers | 4 workers |
|---|---|---|---|---|---|
| Median ± MAD (ms) | 13.077 ± 0.081999 | 21.117 ± 0.057751 | 21.655 ± 0.040250 | 11.840 ± 0.23654 | 7.9038 ± 0.61383 |
| Repetitions | 7 | 7 | 7 | 7 | 7 |
| Corrected serial ÷ time | 1.61× | 1.00× | 0.98× | 1.78× | 2.67× |
| Reused 1 worker ÷ time | 1.66× | 1.03× | 1.00× | 1.83× | 2.74× |
| Legacy serial ÷ time | 1.00× | 0.62× | 0.60× | 1.10× | 1.65× |
| Completed iterations | 20 | 20 | 20 | 20 | 20 |
| Converged | false | false | false | false | false |
| Metric | Legacy serial | Corrected serial | 1 worker | 2 workers | 4 workers |
|---|---|---|---|---|---|
| Median ± MAD (ms) | 4.8413 ± 0.011083 | 7.1431 ± 0.073709 | 7.0951 ± 0.012291 | 3.6573 ± 0.053208 | 1.9753 ± 0.023667 |
| Repetitions | 7 | 7 | 7 | 7 | 7 |
| Corrected serial ÷ time | 1.48× | 1.00× | 1.01× | 1.95× | 3.62× |
| Reused 1 worker ÷ time | 1.47× | 0.99× | 1.00× | 1.94× | 3.59× |
| Legacy serial ÷ time | 1.00× | 0.68× | 0.68× | 1.32× | 2.45× |
One-update batch · N=4096, D=8, clusters=4
N=4,096, Q=32,768, D=8, clusters=4, iteration cap=1, seed=42, synthetic distribution=balanced.
| Metric | Legacy serial | Corrected serial | 1 worker | 2 workers | 4 workers |
|---|---|---|---|---|---|
| Median ± MAD (ms) | 1.2095 ± 0.011167 | 2.2155 ± 0.016749 | 2.2635 ± 0.040375 | 1.2040 ± 0.0063750 | 0.79513 ± 0.023500 |
| Repetitions | 7 | 7 | 7 | 7 | 7 |
| Corrected serial ÷ time | 1.83× | 1.00× | 0.98× | 1.84× | 2.79× |
| Reused 1 worker ÷ time | 1.87× | 1.02× | 1.00× | 1.88× | 2.85× |
| Legacy serial ÷ time | 1.00× | 0.55× | 0.53× | 1.00× | 1.52× |
| Completed iterations | 1 | 1 | 1 | 1 | 1 |
| Converged | false | false | false | false | false |
| Metric | Legacy serial | Corrected serial | 1 worker | 2 workers | 4 workers |
|---|---|---|---|---|---|
| Median ± MAD (ms) | 4.8251 ± 0.012375 | 7.9992 ± 0.048250 | 8.1779 ± 0.14612 | 4.2197 ± 0.011874 | 2.3629 ± 0.073792 |
| Repetitions | 7 | 7 | 7 | 7 | 7 |
| Corrected serial ÷ time | 1.66× | 1.00× | 0.98× | 1.90× | 3.39× |
| Reused 1 worker ÷ time | 1.69× | 1.02× | 1.00× | 1.94× | 3.46× |
| Legacy serial ÷ time | 1.00× | 0.60× | 0.59× | 1.14× | 2.04× |
Cold context creation and destruction — every workload
Each cell reports median ± MAD in milliseconds, followed by repetitions in parentheses. Cold measurements include context creation and destruction; reused measurements exclude them. Pool startup is not hidden inside the scaling comparison.
| Median ± MAD (ms), repetitions | 1 worker | 2 workers | 4 workers |
|---|---|---|---|
| Reused context | 0.064041 ± 0.0044590 (7) | 0.079000 ± 0.017125 (7) | 0.16233 ± 0.011958 (7) |
| Create and destroy context | 0.077291 ± 0.0089160 (7) | 0.14483 ± 0.025417 (7) | 0.23067 ± 0.047333 (7) |
| Median ± MAD (ms), repetitions | 1 worker | 2 workers | 4 workers |
|---|---|---|---|
| Reused context | 0.0078750 ± 0.00054100 (7) | 0.0062910 ± 0.0010430 (7) | 0.012750 ± 0.0060830 (7) |
| Create and destroy context | 0.039583 ± 0.0030840 (7) | 0.067459 ± 0.0058760 (7) | 0.092250 ± 0.0055420 (7) |
| Median ± MAD (ms), repetitions | 1 worker | 2 workers | 4 workers |
|---|---|---|---|
| Reused context | 5.4577 ± 0.018959 (7) | 2.9627 ± 0.058334 (7) | 1.8106 ± 0.033833 (7) |
| Create and destroy context | 5.5490 ± 0.047625 (7) | 3.0724 ± 0.039000 (7) | 1.9154 ± 0.13038 (7) |
| Median ± MAD (ms), repetitions | 1 worker | 2 workers | 4 workers |
|---|---|---|---|
| Reused context | 7.4720 ± 0.091000 (7) | 3.9915 ± 0.062375 (7) | 2.1249 ± 0.032582 (7) |
| Create and destroy context | 7.6766 ± 0.097000 (7) | 4.0503 ± 0.037084 (7) | 2.2476 ± 0.020167 (7) |
| Median ± MAD (ms), repetitions | 1 worker | 2 workers | 4 workers |
|---|---|---|---|
| Reused context | 55.302 ± 0.37437 (7) | 28.308 ± 0.13550 (7) | 15.143 ± 0.11738 (7) |
| Create and destroy context | 55.273 ± 0.065167 (7) | 28.454 ± 0.10742 (7) | 15.799 ± 0.29508 (7) |
| Median ± MAD (ms), repetitions | 1 worker | 2 workers | 4 workers |
|---|---|---|---|
| Reused context | 10.569 ± 0.11571 (7) | 5.3197 ± 0.020249 (7) | 3.0217 ± 0.071792 (7) |
| Create and destroy context | 10.589 ± 0.027041 (7) | 5.4251 ± 0.034667 (7) | 3.0167 ± 0.064916 (7) |
| Median ± MAD (ms), repetitions | 1 worker | 2 workers | 4 workers |
|---|---|---|---|
| Reused context | 341.58 ± 0.33842 (7) | 172.62 ± 0.23583 (7) | 93.825 ± 1.2396 (7) |
| Create and destroy context | 341.97 ± 1.0800 (7) | 173.21 ± 0.037583 (7) | 104.80 ± 0.91817 (7) |
| Median ± MAD (ms), repetitions | 1 worker | 2 workers | 4 workers |
|---|---|---|---|
| Reused context | 62.751 ± 0.15792 (7) | 31.806 ± 0.095209 (7) | 16.070 ± 0.048916 (7) |
| Create and destroy context | 63.018 ± 0.088625 (7) | 31.464 ± 0.044250 (7) | 16.665 ± 0.20479 (7) |
| Median ± MAD (ms), repetitions | 1 worker | 2 workers | 4 workers |
|---|---|---|---|
| Reused context | 93.638 ± 0.13983 (7) | 47.480 ± 0.10054 (7) | 28.646 ± 1.4981 (7) |
| Create and destroy context | 93.500 ± 0.32625 (7) | 49.386 ± 0.88321 (7) | 27.673 ± 0.15063 (7) |
| Median ± MAD (ms), repetitions | 1 worker | 2 workers | 4 workers |
|---|---|---|---|
| Reused context | 12.828 ± 0.063625 (7) | 6.5280 ± 0.051250 (7) | 3.6421 ± 0.082417 (7) |
| Create and destroy context | 13.021 ± 0.083958 (7) | 6.5108 ± 0.021958 (7) | 3.5611 ± 0.094418 (7) |
| Median ± MAD (ms), repetitions | 1 worker | 2 workers | 4 workers |
|---|---|---|---|
| Reused context | 0.74246 ± 0.0029590 (7) | 0.39063 ± 0.0031250 (7) | 0.30892 ± 0.0094590 (7) |
| Create and destroy context | 0.75392 ± 0.0062490 (7) | 0.44871 ± 0.0065410 (7) | 0.36950 ± 0.0030420 (7) |
| Median ± MAD (ms), repetitions | 1 worker | 2 workers | 4 workers |
|---|---|---|---|
| Reused context | 8.3009 ± 0.013125 (7) | 4.1979 ± 0.030500 (7) | 2.3080 ± 0.090167 (7) |
| Create and destroy context | 8.4000 ± 0.015001 (7) | 4.3032 ± 0.050583 (7) | 2.3859 ± 0.074417 (7) |
| Median ± MAD (ms), repetitions | 1 worker | 2 workers | 4 workers |
|---|---|---|---|
| Reused context | 11.821 ± 0.034041 (7) | 6.4126 ± 0.15737 (7) | 4.0386 ± 0.15683 (7) |
| Create and destroy context | 11.977 ± 0.17700 (7) | 6.3655 ± 0.056917 (7) | 4.3361 ± 0.35596 (7) |
| Median ± MAD (ms), repetitions | 1 worker | 2 workers | 4 workers |
|---|---|---|---|
| Reused context | 7.6230 ± 0.060792 (7) | 3.9058 ± 0.0065830 (7) | 2.4747 ± 0.12113 (7) |
| Create and destroy context | 7.7270 ± 0.071708 (7) | 4.5602 ± 0.47208 (7) | 2.5103 ± 0.12008 (7) |
| Median ± MAD (ms), repetitions | 1 worker | 2 workers | 4 workers |
|---|---|---|---|
| Reused context | 21.655 ± 0.040250 (7) | 11.840 ± 0.23654 (7) | 7.9038 ± 0.61383 (7) |
| Create and destroy context | 21.749 ± 0.012958 (7) | 13.040 ± 0.68929 (7) | 7.9622 ± 0.32004 (7) |
| Median ± MAD (ms), repetitions | 1 worker | 2 workers | 4 workers |
|---|---|---|---|
| Reused context | 7.0951 ± 0.012291 (7) | 3.6573 ± 0.053208 (7) | 1.9753 ± 0.023667 (7) |
| Create and destroy context | 7.1392 ± 0.033209 (7) | 3.7609 ± 0.016625 (7) | 2.0567 ± 0.058167 (7) |
| Median ± MAD (ms), repetitions | 1 worker | 2 workers | 4 workers |
|---|---|---|---|
| Reused context | 2.2635 ± 0.040375 (7) | 1.2040 ± 0.0063750 (7) | 0.79513 ± 0.023500 (7) |
| Create and destroy context | 2.2826 ± 0.010750 (7) | 1.2730 ± 0.011167 (7) | 0.93112 ± 0.0077080 (7) |
| Median ± MAD (ms), repetitions | 1 worker | 2 workers | 4 workers |
|---|---|---|---|
| Reused context | 8.1779 ± 0.14612 (7) | 4.2197 ± 0.011874 (7) | 2.3629 ± 0.073792 (7) |
| Create and destroy context | 8.0258 ± 0.26500 (7) | 4.2960 ± 0.047458 (7) | 2.4812 ± 0.11513 (7) |
Charged workspace admission
These are checked charged bytes for an individual operation on the recorded ABI. Every listed boundary rejects a budget one byte below its charge and accepts the exact charged budget. The charge is an admission-accounting quantity, not process RSS, peak allocator use or the whole memory footprint. The default workspace limit is 64 MiB, a cap, not a fixed allocation.
Fit admission includes newly fitted centers and labels along with working capacities and bounded controls. Prediction includes its new output and controls, while the existing immutable model is outside that call's charge. Source Tensor storage and host caches, executor internals, callback/context snapshot payloads, opaque ownership and allocator overhead, thread stacks and process RSS are excluded. Worker-private scratch can grow with active lanes. These scopes follow the recorded implementation and ABI; unmeasured workload/operation pairs have no inferred memory value.
| Workload | Operation | Execution | Active lanes | Charged bytes | Charged KiB |
|---|---|---|---|---|---|
| Batch | Fit | Corrected serial | 1 | 67,532 | 65.949 |
| Batch | Fit | 1 worker | 1 | 67,532 | 65.949 |
| Batch | Fit | 2 workers | 2 | 68,368 | 66.766 |
| Batch | Fit | 4 workers | 4 | 70,040 | 68.398 |
| Batch | Prediction | Corrected serial | 1 | 262,528 | 256.375 |
| Batch | Prediction | 1 worker | 1 | 262,528 | 256.375 |
| Batch | Prediction | 2 workers | 2 | 262,544 | 256.391 |
| Batch | Prediction | 4 workers | 4 | 262,576 | 256.422 |
| Wide | Fit | Corrected serial | 1 | 38,412 | 37.512 |
| Wide | Fit | 1 worker | 1 | 38,412 | 37.512 |
| Wide | Fit | 2 workers | 2 | 39,248 | 38.328 |
| Wide | Fit | 4 workers | 4 | 40,920 | 39.961 |
| Wide | Prediction | Corrected serial | 1 | 33,152 | 32.375 |
| Wide | Prediction | 1 worker | 1 | 33,152 | 32.375 |
| Wide | Prediction | 2 workers | 2 | 33,168 | 32.391 |
| Wide | Prediction | 4 workers | 4 | 33,200 | 32.422 |
Process memory, measured separately
Each RSS sample comes from a fresh process and records the getrusage lifetime high-water mark. The table reports the maximum recorded sample in MiB. It includes executable/runtime overhead, inputs, model state, executor resources and the operation. Prediction RSS also includes the prerequisite serial fit that created that implementation's model. No input baseline has been subtracted. This cannot be read as isolated kernel scratch or compared directly with charged workspace as if they measured the same scope. Platform RSS units are normalized to bytes in the downloadable report.
| Workload | Operation | Implementation | Execution | Peak MiB | Fresh processes |
|---|---|---|---|---|---|
| Batch | Fit | legacy | Serial | 8.000 | 3 |
| Batch | Fit | corrected | Serial | 7.938 | 3 |
| Batch | Fit | corrected | 1 worker · reused pool | 7.938 | 3 |
| Batch | Fit | corrected | 2 workers · reused pool | 7.969 | 3 |
| Batch | Fit | corrected | 4 workers · reused pool | 7.984 | 3 |
| Batch | Prediction | legacy | Serial | 8.281 | 3 |
| Batch | Prediction | corrected | Serial | 8.188 | 3 |
| Batch | Prediction | corrected | 1 worker · reused pool | 8.203 | 3 |
| Batch | Prediction | corrected | 2 workers · reused pool | 8.219 | 3 |
| Batch | Prediction | corrected | 4 workers · reused pool | 8.250 | 3 |
| Wide | Fit | legacy | Serial | 7.234 | 3 |
| Wide | Fit | corrected | Serial | 7.156 | 3 |
| Wide | Fit | corrected | 1 worker · reused pool | 7.203 | 3 |
| Wide | Fit | corrected | 2 workers · reused pool | 7.219 | 3 |
| Wide | Fit | corrected | 4 workers · reused pool | 7.250 | 3 |
| Wide | Prediction | legacy | Serial | 7.250 | 3 |
| Wide | Prediction | corrected | Serial | 7.188 | 3 |
| Wide | Prediction | corrected | 1 worker · reused pool | 7.188 | 3 |
| Wide | Prediction | corrected | 2 workers · reused pool | 7.203 | 3 |
| Wide | Prediction | corrected | 4 workers · reused pool | 7.234 | 3 |
Accuracy and determinism
The recorded independent numerical oracle passes 14,584 cases, including cancellation in means, tiny residuals, inertia underflow and finite/overflow boundaries. A finite center must remain within the coordinate bounds of its assigned population. Such checks assess the numerical update; they do not establish global optimality for Lloyd clustering. Inertia accumulates the exact squares of the computed Float64 distance norms before final rounding; the distance norms themselves still use floating-point subtraction and hypot.
Corrected serial and admitted 1, 2 and 4 worker executions are compared bitwise in the same binary and floating-point environment: centers, fitted labels, query predictions, inertia, completed iterations and convergence flags. This is a same-build promise; it does not claim identical results across different platforms, compiler versions or math libraries. Legacy results are evaluated separately because correcting numerical behavior can legitimately change them.
Distance ties choose the lowest center index; an empty cluster retains its previous center. Final fitted labels and inertia are recomputed against the returned centers. At an iteration cap or a tolerance stop, those final assignments need not be the memberships used for the last center update. A final center is therefore not asserted to be the mean of the final labels unless the assignments have stabilized.
Validation also covers cancellation, deterministic failures and context reuse. A cancelled or failed call returns no partial successful fitted model or prediction Tensor. All workers must finish before scratch or captured inputs are released. The downloadable report identifies the exact validation and source revisions used for these observations.
Scope and reproduction
| Operating system | macOS-26.7.2-arm64-arm-64bit |
|---|---|
| Kernel | Darwin 25.6.0 |
| Physical CPU reported by host | Apple M2 Max |
| Architecture / logical CPUs | arm64 / 12 |
| Compiler | Apple clang version 21.0.0 (clang-2100.3.34.2) Target: arm64-apple-darwin25.6.0 Thread model: posix InstalledDir: /Library/Developer/CommandLineTools/usr/bin |
| Build / LTO | Release / ThinLTO |
| Compiler CPU profile | apple-m1 (instruction baseline, separate from host identification) |
Recorded 2026-10-30. Timings use a matched Release build with ThinLTO, strict -fno-fast-math and -ffp-contract=off. Raw observations, build and machine identities, numerical validation, workspace admission and fresh-process RSS samples are downloadable together. Medians and MADs on this page are recomputed from the raw samples; MAD describes sample dispersion, not a confidence interval.
With I completed Lloyd updates, fitting retains O((I+1)NkD) distance work, including final reassignment. Prediction remains O(QkD). Parallelism changes elapsed time, not the declared distance count or admission limits. The fitting cap uses (max_iterations+1)NkD ≤ 50,000,000; prediction uses QkD ≤ 50,000,000, and each Tensor is bounded to one million elements. The cap is checked using the requested iteration maximum, even when fitting converges earlier.
These local CPU measurements do not establish GPU, cluster or universal speedups. Worker counts describe admitted local concurrency, not pinned or dedicated cores. The native KMeans implementation does not extend the bounded aner build Tensor/model lowering subset. Reproduce comparisons using the report's exact source, build flags, dataset generator, seed, controls and timing boundaries; keep verification outside the timed region.
See the KMeans contract, recorded benchmark study, implementation and validation notes, complete local execution example and serial reference example. The standalone benchmark figure and plot reproduction tool present the same evidence in an exportable form. No development runtime package is published with this page.