
Distributed Dense training benchmark
Matched native CPU and accelerator training on three configurations, alone and together, with measured timing, memory, held out quality and verified weighted gradients.
This controlled experiment measures native Dense training on CPU, Metal/MPS and CUDA, separately and in explicitly configured groups. All 57 measured trials across 19 cases passed the fixed scientific and numerical checks. Nineteen additional warm ups are excluded from timing statistics. The fixture tests portable execution and learning quality; it does not establish real world task accuracy or peak hardware throughput.
Scientific contract
| Setting | Fixed value |
|---|---|
| Source | Native linear teacher generator; 65,536 rows, 64 finite uniform features, four classes; seed 42 |
| Protected roles | 45,876 training, 9,830 validation and 9,830 test rows; stratified split seed 42 |
| Model | Dense 64 → 128 → 64 → 4; ReLU hidden layers; 16,836 parameters; seeded Xavier MLP initialization |
| Preprocessing | Population standardization fitted only to training rows |
| Loss/update | Cross entropy; SGD rate 0.05; one canonical CPU update in the selected group dtype |
| Batch/horizon | Global batch 1,536; ten epochs; 300 updates; final batch 1,332 rows retained each epoch |
| Precision | Float32 CPU/MPS/CUDA; Float64 CPU/CUDA. Host SUM/count accumulation is Float64; canonical parameters/optimizer state retain selected group dtype |
| Repetition | One excluded warm up and three fresh command repetitions per case; fixed seed 42 |
Every selected worker returned gradients in its declared native backend. Global row counts, source and partition fingerprints, fixed update counts and declared weight/tail allocations agree. Validation/test rows never supply gradients or normalization statistics. GPU replicas perform forward/backward; Dataset preparation, canonical updates and final fitted evaluation use CPU.
The native source contract is 43aaceb4725f52a5136643b824d790c26600f92378c6cf753287c0b069d5211a. Dataset source identity is 72bde3eff8b278c07be2746ea50d317557c7534244eee0452f1f7907e0f36562. The complete Aner exploration source and distributed neural guide expose the scientific and execution choices.
Platform configurations
| Immutable configuration | Processor / accelerator | Visible CPU slots | RAM scope | Native provider policy |
|---|---|---|---|---|
Atlas-01 / C03 | Apple M2 Max / Apple M2 Max | 12 | 64.00 GiB; installed unified RAM | apple_accelerate; one requested; actual unavailable |
Atlas-02 / C03 | Virtual CPU (model unavailable) / NVIDIA GeForce GTX1060 3GB | 2 | 15.05 GiB; guest visible Linux MemTotal; not measured RSS | openblas; one requested; actual 1 |
Atlas-03 / C03 | Virtual CPU (model unavailable) / Tesla V100 PCIE 32GB | 24 | 60.47 GiB; guest visible Linux MemTotal; not measured RSS | openblas; one requested; actual 1 |
These are configuration capacities, not measured process use or dedicated core guarantees. Atlas identities are opaque inventory numbers; configuration revisions preserve hardware/software policy changes. Earlier MNIST measurements and CPU task measurements retain their historical configurations and results.
Duration and scaling
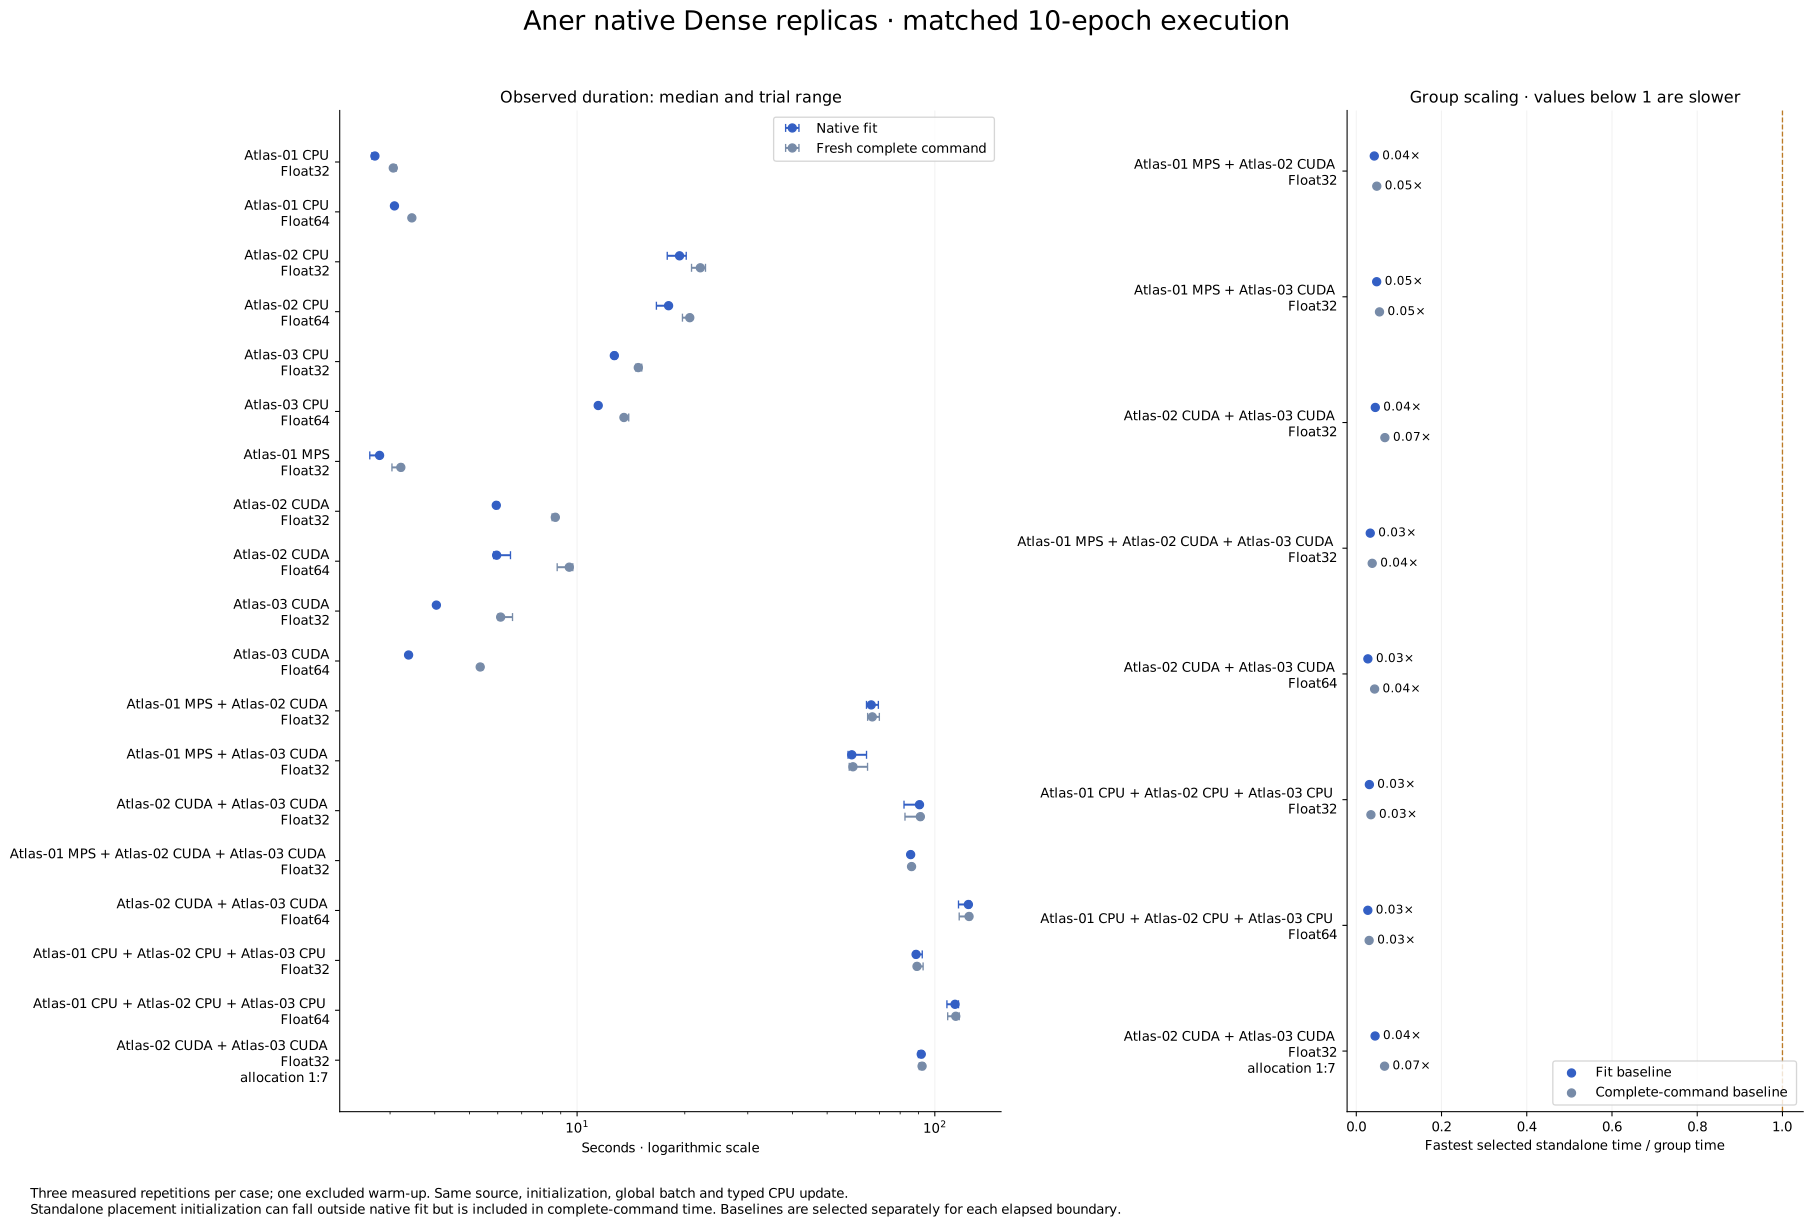
Open the duration chart · Download PNG
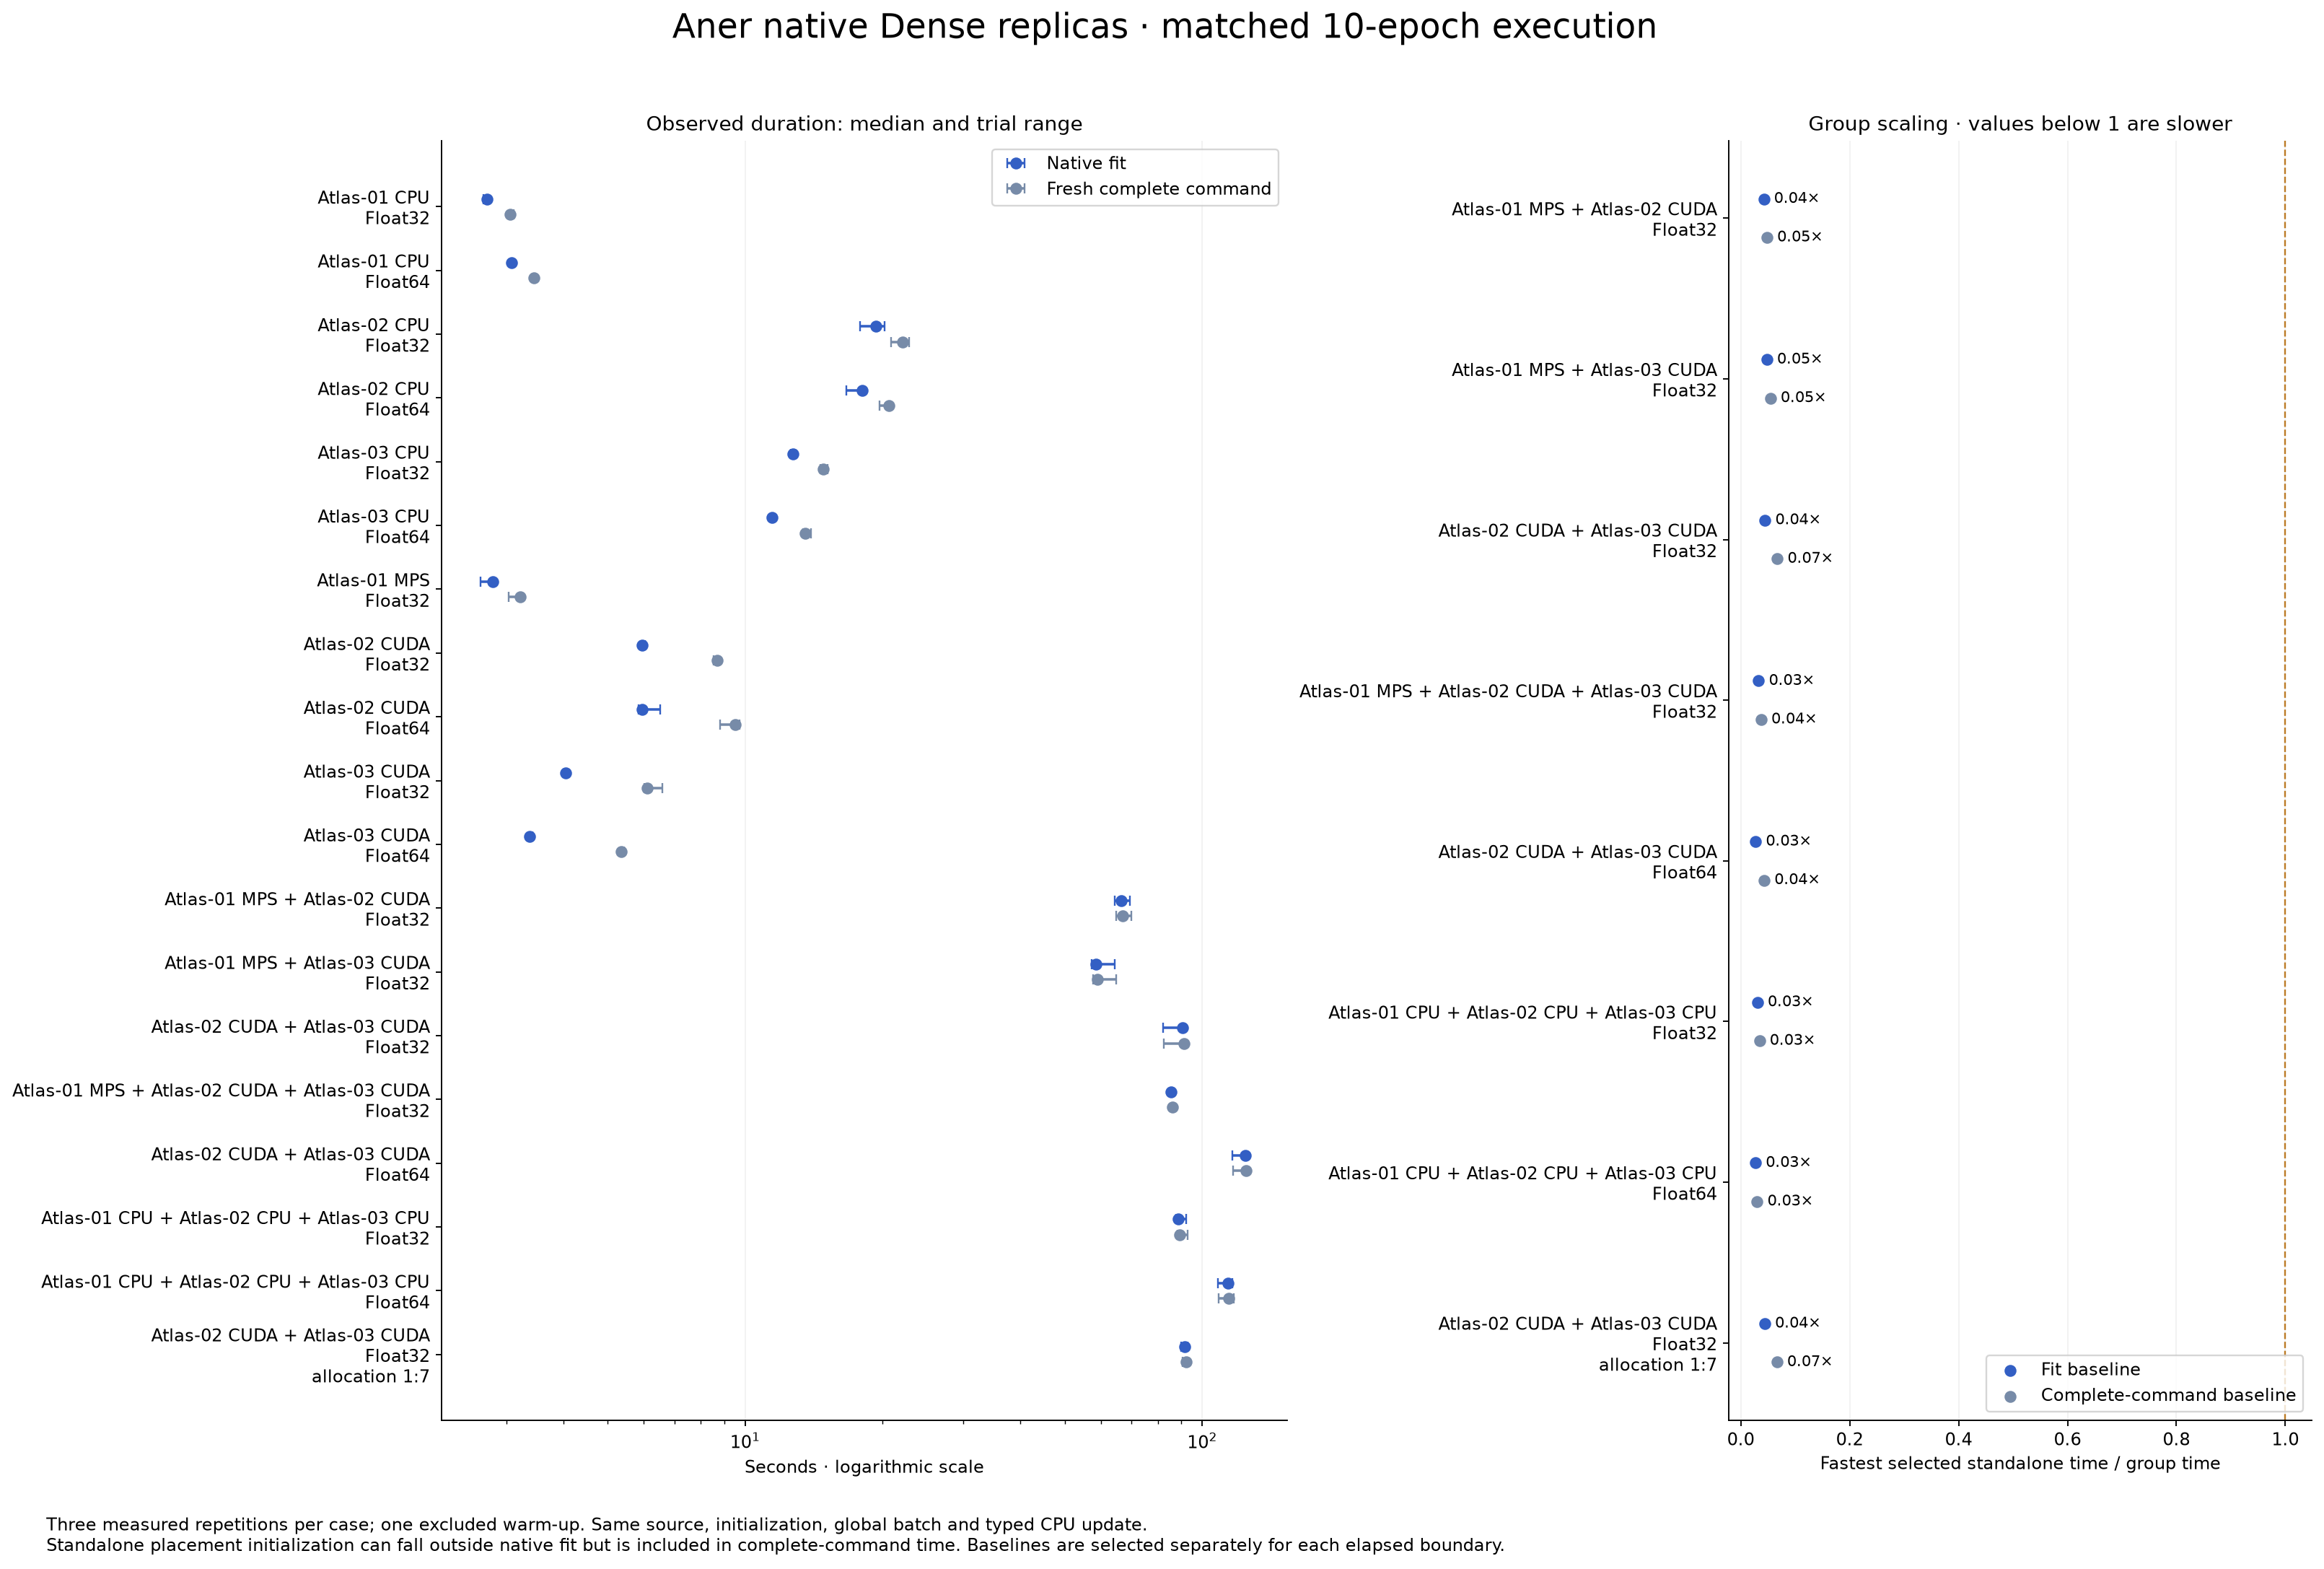
The table gives median and observed minimum: maximum seconds over three repetitions. These ranges are descriptive, not confidence intervals. Complete command time includes source generation/partitioning, preprocessing, placement/process/SSH initialization, training, validation/final test and shutdown. All cases omit native checkpoint/report file I/O. Compilation and source staging occur outside the timing window. Native fit and complete command time have separate boundaries: standalone backend initialization may precede fit, while configured worker initialization can occur inside fit.
| Placement / dtype | Native fit seconds: median [range] | Complete command seconds: median [range] | Held out test accuracy | Test cross entropy |
|---|---|---|---|---|
Atlas-01 CPU · Float32 | 2.7211 [2.6704 to 2.7432] | 3.0629 [3.0538 to 3.1175] | 89.55% | 0.297054 |
Atlas-01 CPU · Float64 | 3.0861 [3.0773 to 3.0974] | 3.4517 [3.4309 to 3.4779] | 89.55% | 0.297053 |
Atlas-02 CPU · Float32 | 19.3351 [17.8642 to 20.1869] | 22.1044 [20.8876 to 22.8521] | 89.55% | 0.297053 |
Atlas-02 CPU · Float64 | 18.0180 [16.6598 to 18.0718] | 20.6516 [19.7015 to 20.8107] | 89.55% | 0.297053 |
Atlas-03 CPU · Float32 | 12.7087 [12.5878 to 12.8603] | 14.8287 [14.5909 to 15.1606] | 89.55% | 0.297053 |
Atlas-03 CPU · Float64 | 11.4566 [11.4367 to 11.4791] | 13.5185 [13.4066 to 13.9420] | 89.55% | 0.297053 |
Atlas-01 MPS · Float32 | 2.8042 [2.6329 to 2.8168] | 3.2152 [3.0367 to 3.2553] | 89.55% | 0.297054 |
Atlas-02 CUDA · Float32 | 5.9443 [5.9041 to 6.0290] | 8.6921 [8.5151 to 8.7703] | 89.55% | 0.297056 |
Atlas-02 CUDA · Float64 | 5.9581 [5.8432 to 6.5129] | 9.5087 [8.7968 to 9.7268] | 89.55% | 0.297053 |
Atlas-03 CUDA · Float32 | 4.0420 [4.0253 to 4.0459] | 6.1135 [6.0218 to 6.5987] | 89.55% | 0.297054 |
Atlas-03 CUDA · Float64 | 3.3800 [3.3518 to 3.4232] | 5.3596 [5.3255 to 5.4403] | 89.55% | 0.297053 |
Atlas-01 MPS + Atlas-02 CUDA · Float32 | 66.4068 [64.4150 to 69.5335] | 66.8676 [64.8878 to 69.9777] | 89.55% | 0.297055 |
Atlas-01 MPS + Atlas-03 CUDA · Float32 | 58.5972 [57.2089 to 64.4325] | 59.0436 [57.6454 to 64.8584] | 89.55% | 0.297056 |
Atlas-02 CUDA + Atlas-03 CUDA · Float32 | 90.6031 [82.0128 to 91.6780] | 91.1092 [82.5244 to 92.1647] | 89.55% | 0.297056 |
Atlas-01 MPS + Atlas-02 CUDA + Atlas-03 CUDA · Float32 | 85.5909 [85.5678 to 86.2928] | 86.0938 [86.0767 to 86.7966] | 89.55% | 0.297053 |
Atlas-02 CUDA + Atlas-03 CUDA · Float64 | 124.1251 [116.4679 to 125.6942] | 124.6553 [116.9992 to 126.2309] | 89.55% | 0.297053 |
Atlas-01 CPU + Atlas-02 CPU + Atlas-03 CPU · Float32 | 88.6459 [87.6388 to 92.2319] | 89.1634 [88.2181 to 92.7419] | 89.55% | 0.297054 |
Atlas-01 CPU + Atlas-02 CPU + Atlas-03 CPU · Float64 | 113.8934 [108.1030 to 116.4695] | 114.4400 [108.6370 to 117.0271] | 89.55% | 0.297053 |
Atlas-02 CUDA + Atlas-03 CUDA · Float32 · allocation 1:7 | 91.6420 [90.0050 to 92.7273] | 92.1320 [90.5023 to 93.2488] | 89.55% | 0.297053 |
Float32 had a shorter median CPU fit on Atlas-01, while Float64 had a shorter median CUDA fit on Atlas-03. Both precisions retained the same held out test accuracy in this fixture. Precision alone does not determine elapsed time or all host storage peaks; the backend and complete update/staging path are part of the measurement.
| Group | Fastest selected fit reference | Fit speedup | Fastest selected complete command reference | Complete command speedup |
|---|---|---|---|---|
Atlas-01 MPS + Atlas-02 CUDA · Float32 | Atlas-01 MPS · Float32 | 0.042× | Atlas-01 MPS · Float32 | 0.048× |
Atlas-01 MPS + Atlas-03 CUDA · Float32 | Atlas-01 MPS · Float32 | 0.048× | Atlas-01 MPS · Float32 | 0.054× |
Atlas-02 CUDA + Atlas-03 CUDA · Float32 | Atlas-03 CUDA · Float32 | 0.045× | Atlas-03 CUDA · Float32 | 0.067× |
Atlas-01 MPS + Atlas-02 CUDA + Atlas-03 CUDA · Float32 | Atlas-01 MPS · Float32 | 0.033× | Atlas-01 MPS · Float32 | 0.037× |
Atlas-02 CUDA + Atlas-03 CUDA · Float64 | Atlas-03 CUDA · Float64 | 0.027× | Atlas-03 CUDA · Float64 | 0.043× |
Atlas-01 CPU + Atlas-02 CPU + Atlas-03 CPU · Float32 | Atlas-01 CPU · Float32 | 0.031× | Atlas-01 CPU · Float32 | 0.034× |
Atlas-01 CPU + Atlas-02 CPU + Atlas-03 CPU · Float64 | Atlas-01 CPU · Float64 | 0.027× | Atlas-01 CPU · Float64 | 0.030× |
Atlas-02 CUDA + Atlas-03 CUDA · Float32 · allocation 1:7 | Atlas-03 CUDA · Float32 | 0.044× | Atlas-03 CUDA · Float32 | 0.066× |
0 of 8 groups had a lower median native fit time than their fastest selected standalone placement. Values below 1 indicate slower group execution; unfavorable outcomes remain in the report. Baseline selection is independent for fit and complete command time, and the JSON identifies both. This workload does not imply that two computers always improve training speed.
Learning and numerical agreement
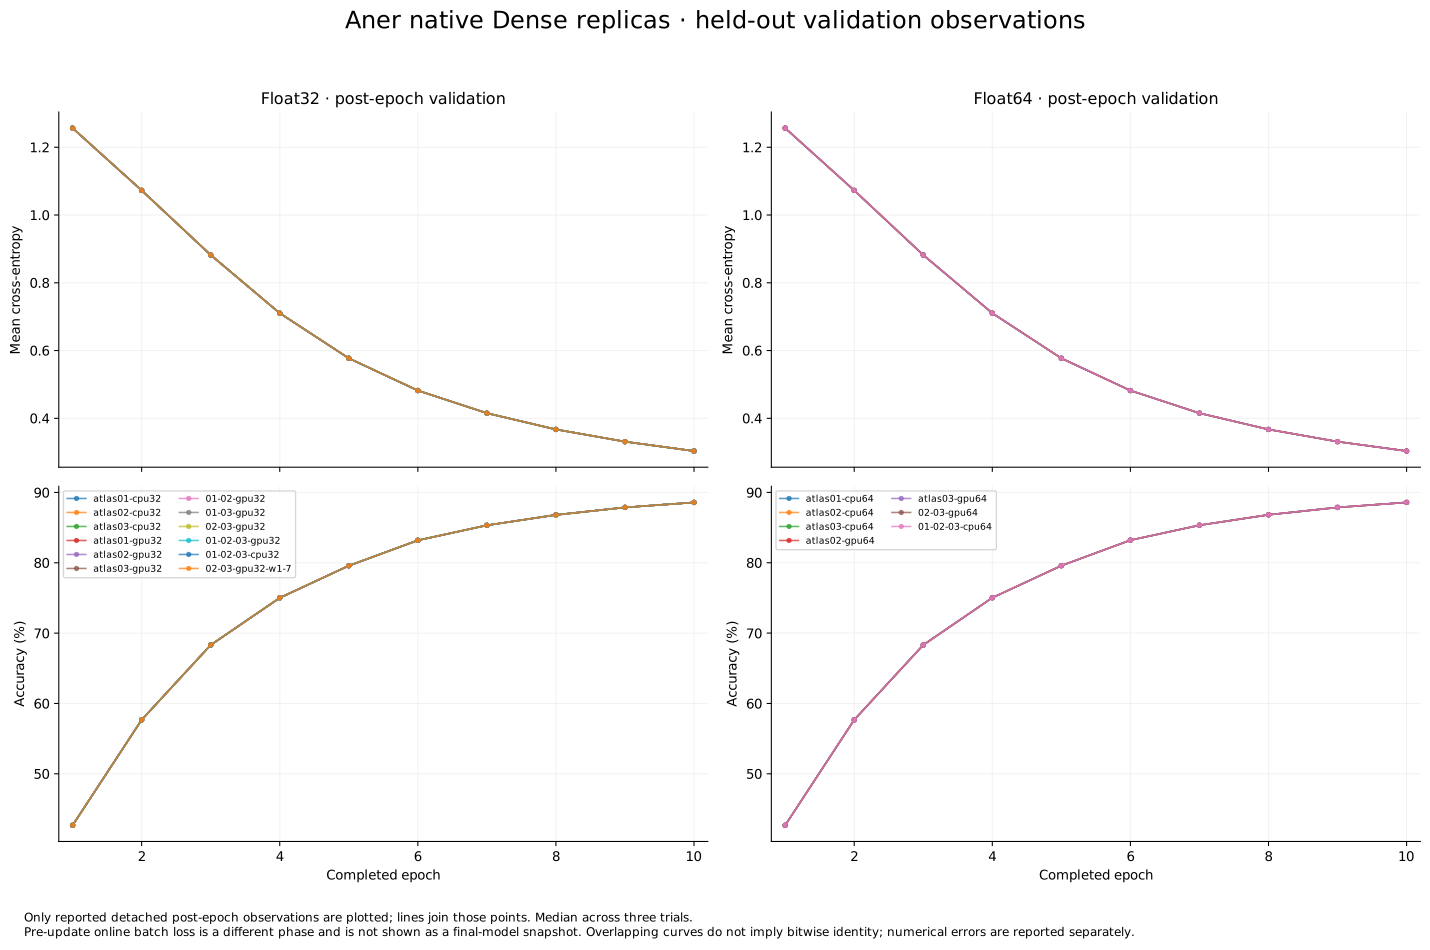
Open the validation chart · Download PNG
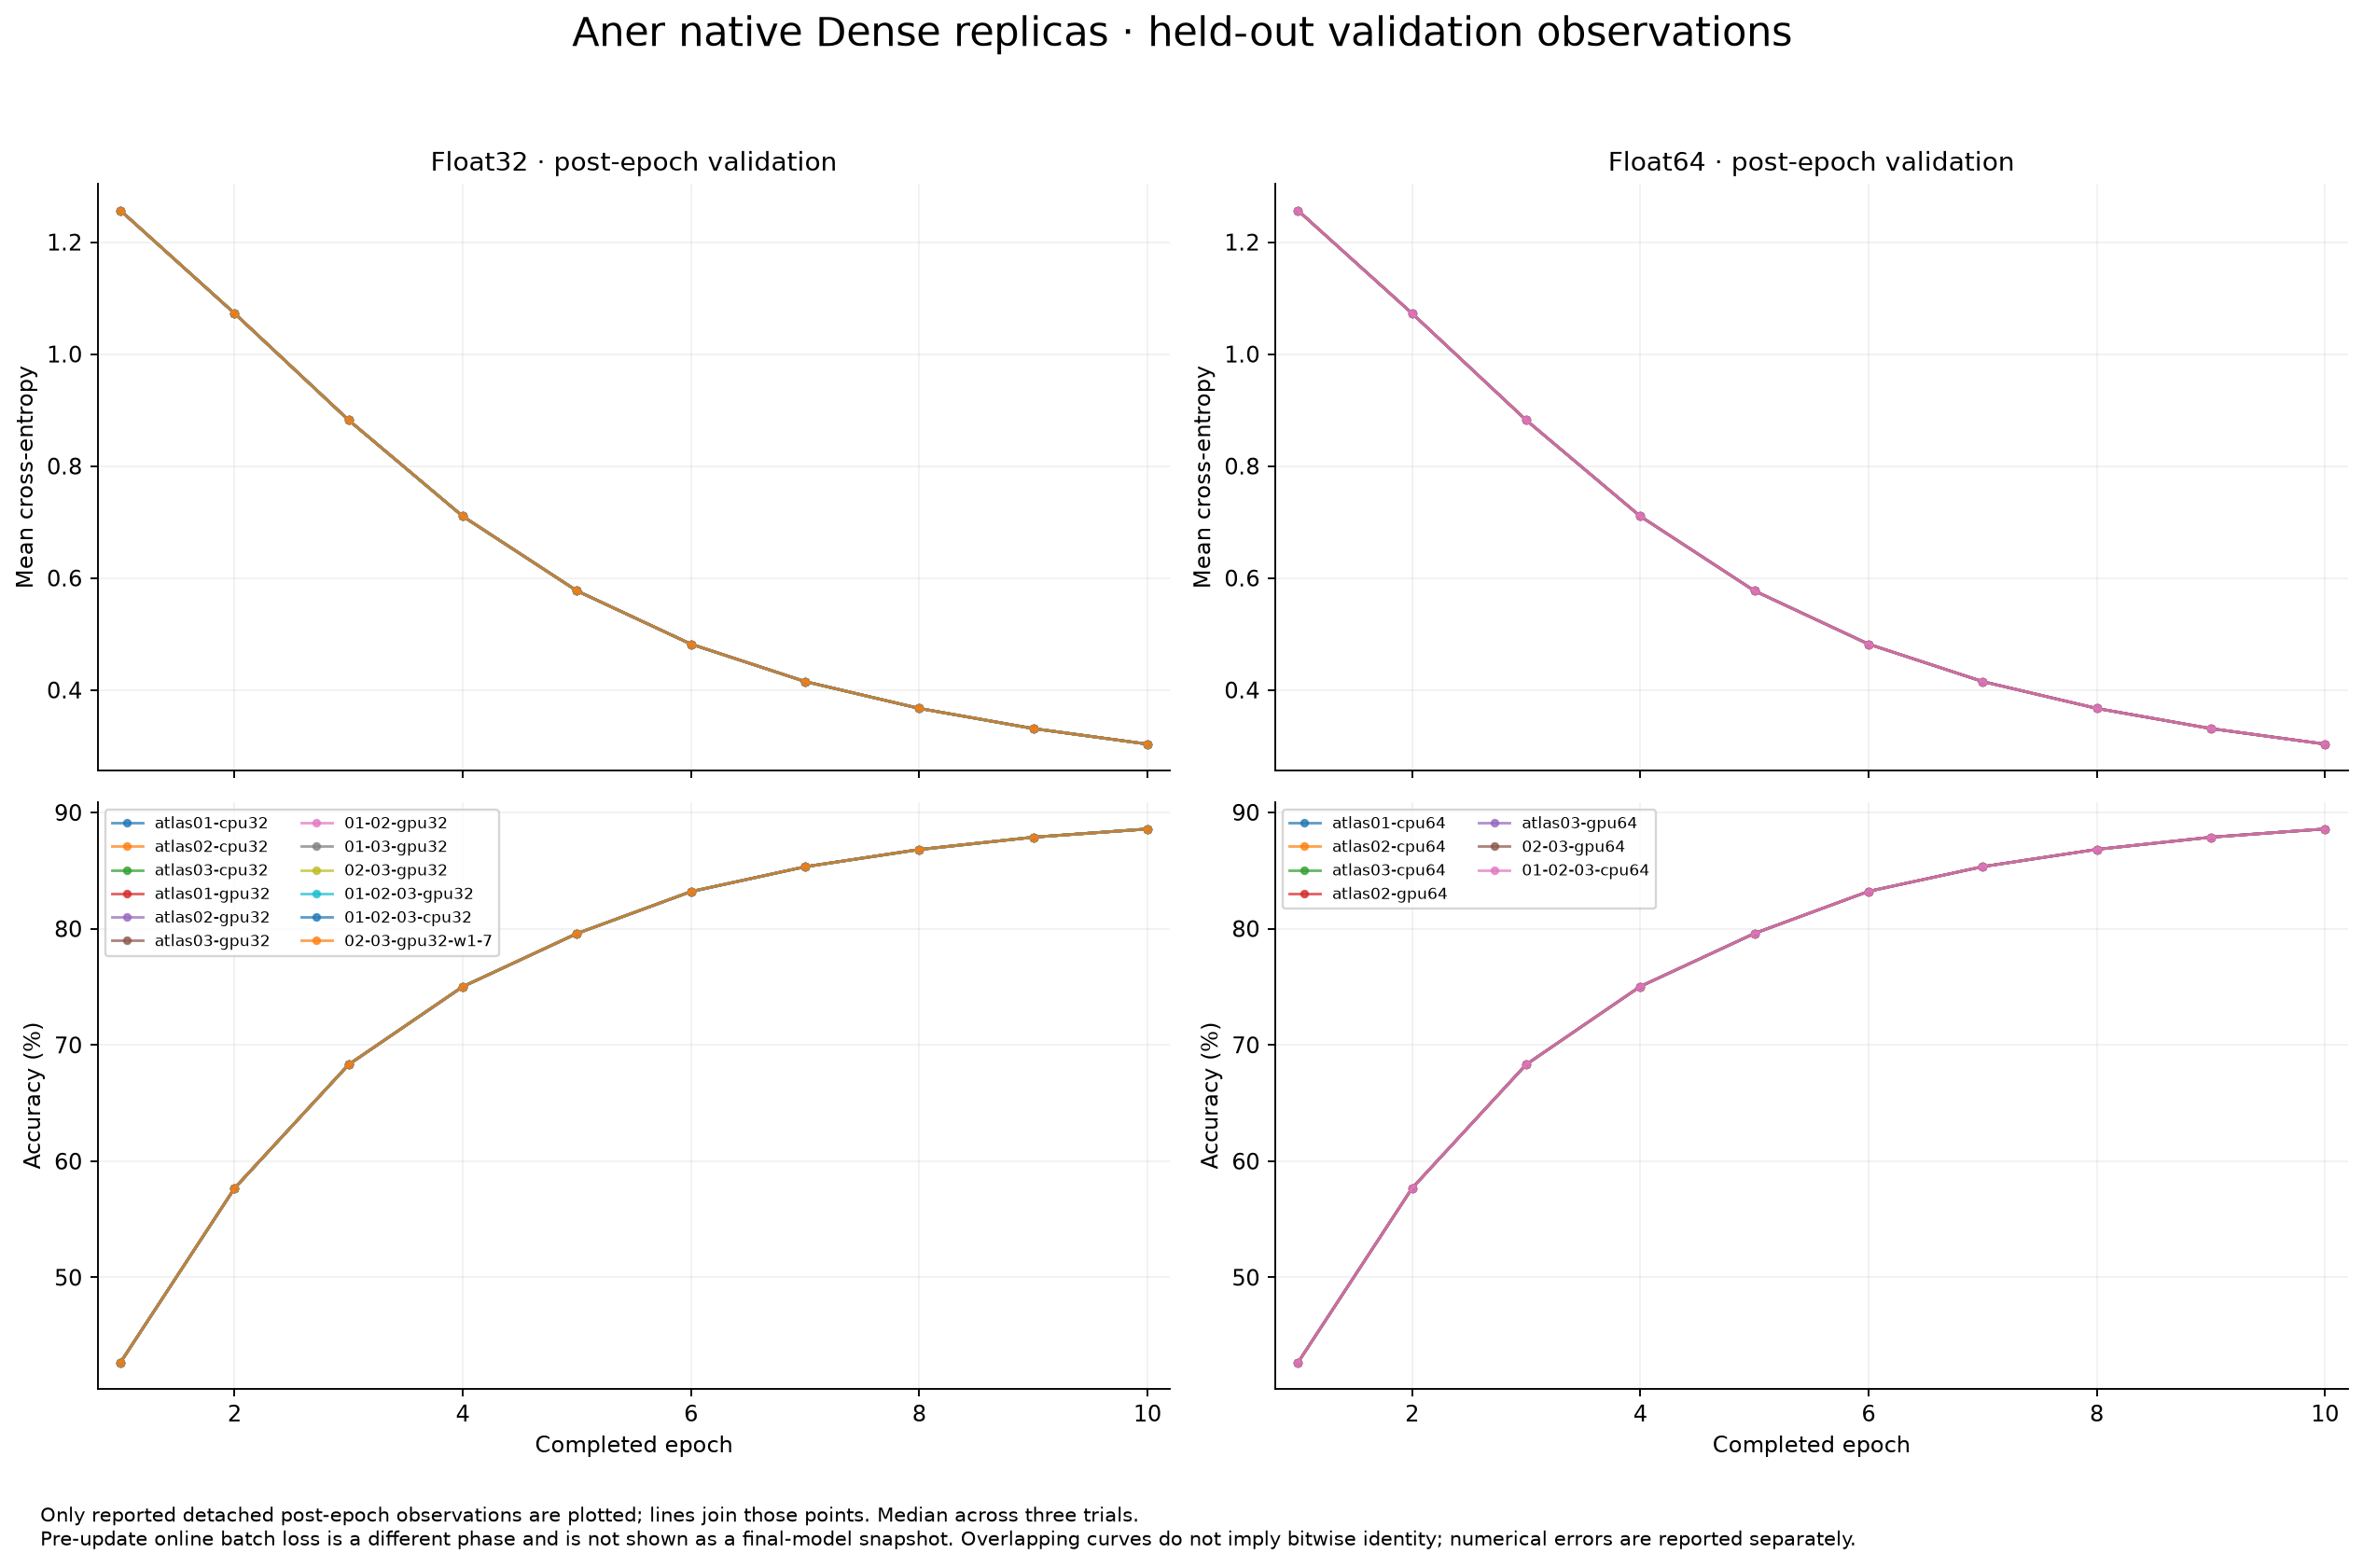
The plots use actual detached post epoch validation observations. Pre update online batch loss is a different phase and is not presented as a final model loss snapshot. Final held out test measurements appear in the table; test rows remain outside model selection. Curves can overlap despite small numerical differences.
| Compute dtype | Maximum absolute parameter difference | Maximum absolute loss difference | Maximum absolute accuracy fraction difference | Predeclared limits: parameter / loss / accuracy |
|---|---|---|---|---|
| Float32 | 5.98e 05 | 2.67e 06 | 0.000102 | 0.001 / 0.0005 / 0.005 |
| Float64 | 3.33e 16 | 1.11e 16 | 0 | 1e 08 / 1e 08 / 1e 12 |
Each dtype uses its predeclared standalone CPU reference and first measured trial. Complete retained parameter vectors are compared before publication; hashes and independently recomputed errors are public, while full vectors stay internal. Cross precision quality is descriptive: Float32 and Float64 parameters do not use one shared tight tolerance. The unequal Float32 CUDA allocation case uses relative weights 1:7 but retains the same global rows and one update per batch.
Memory and phase observations
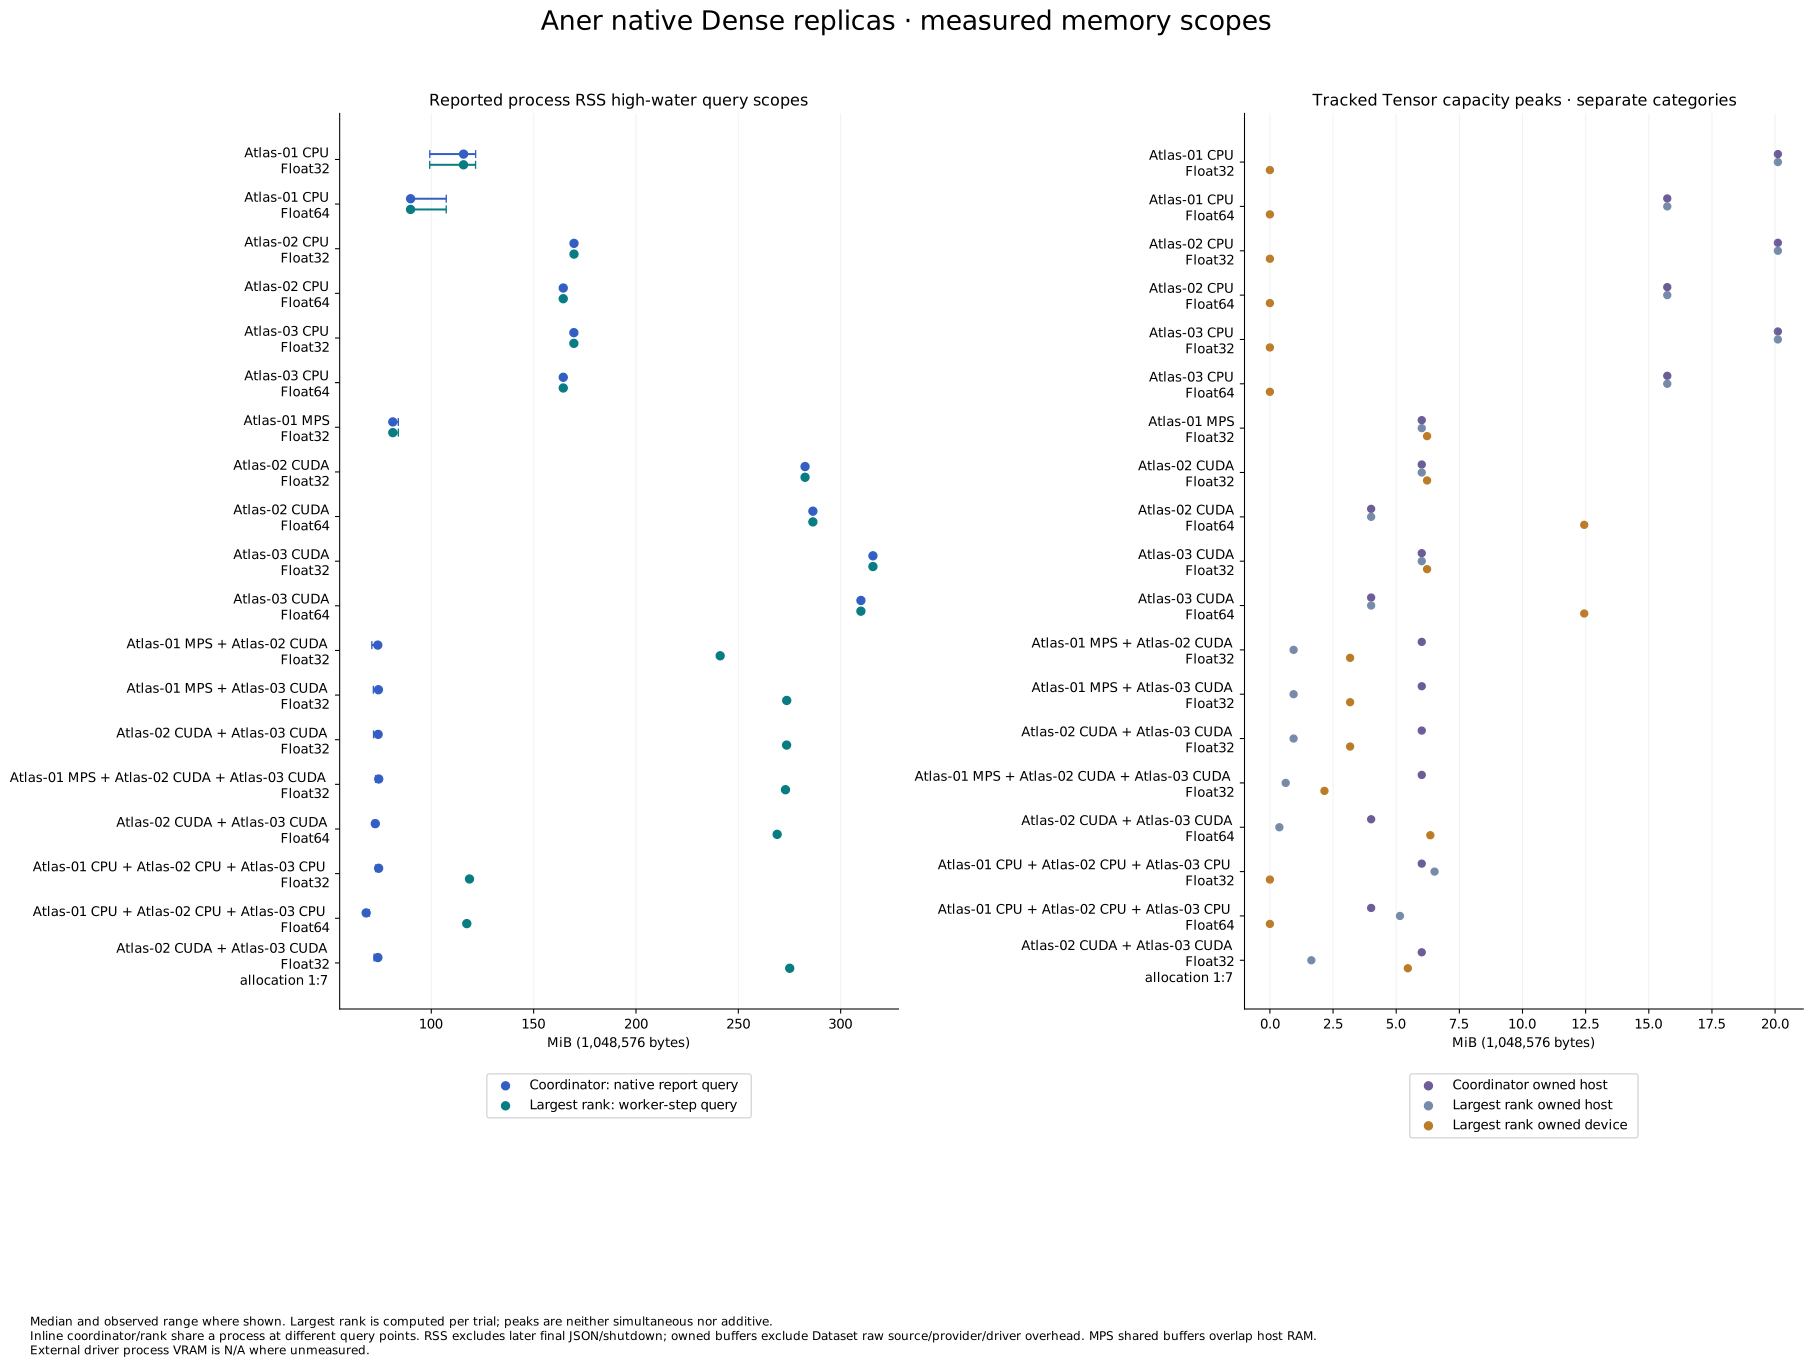
Open the memory chart · Download PNG
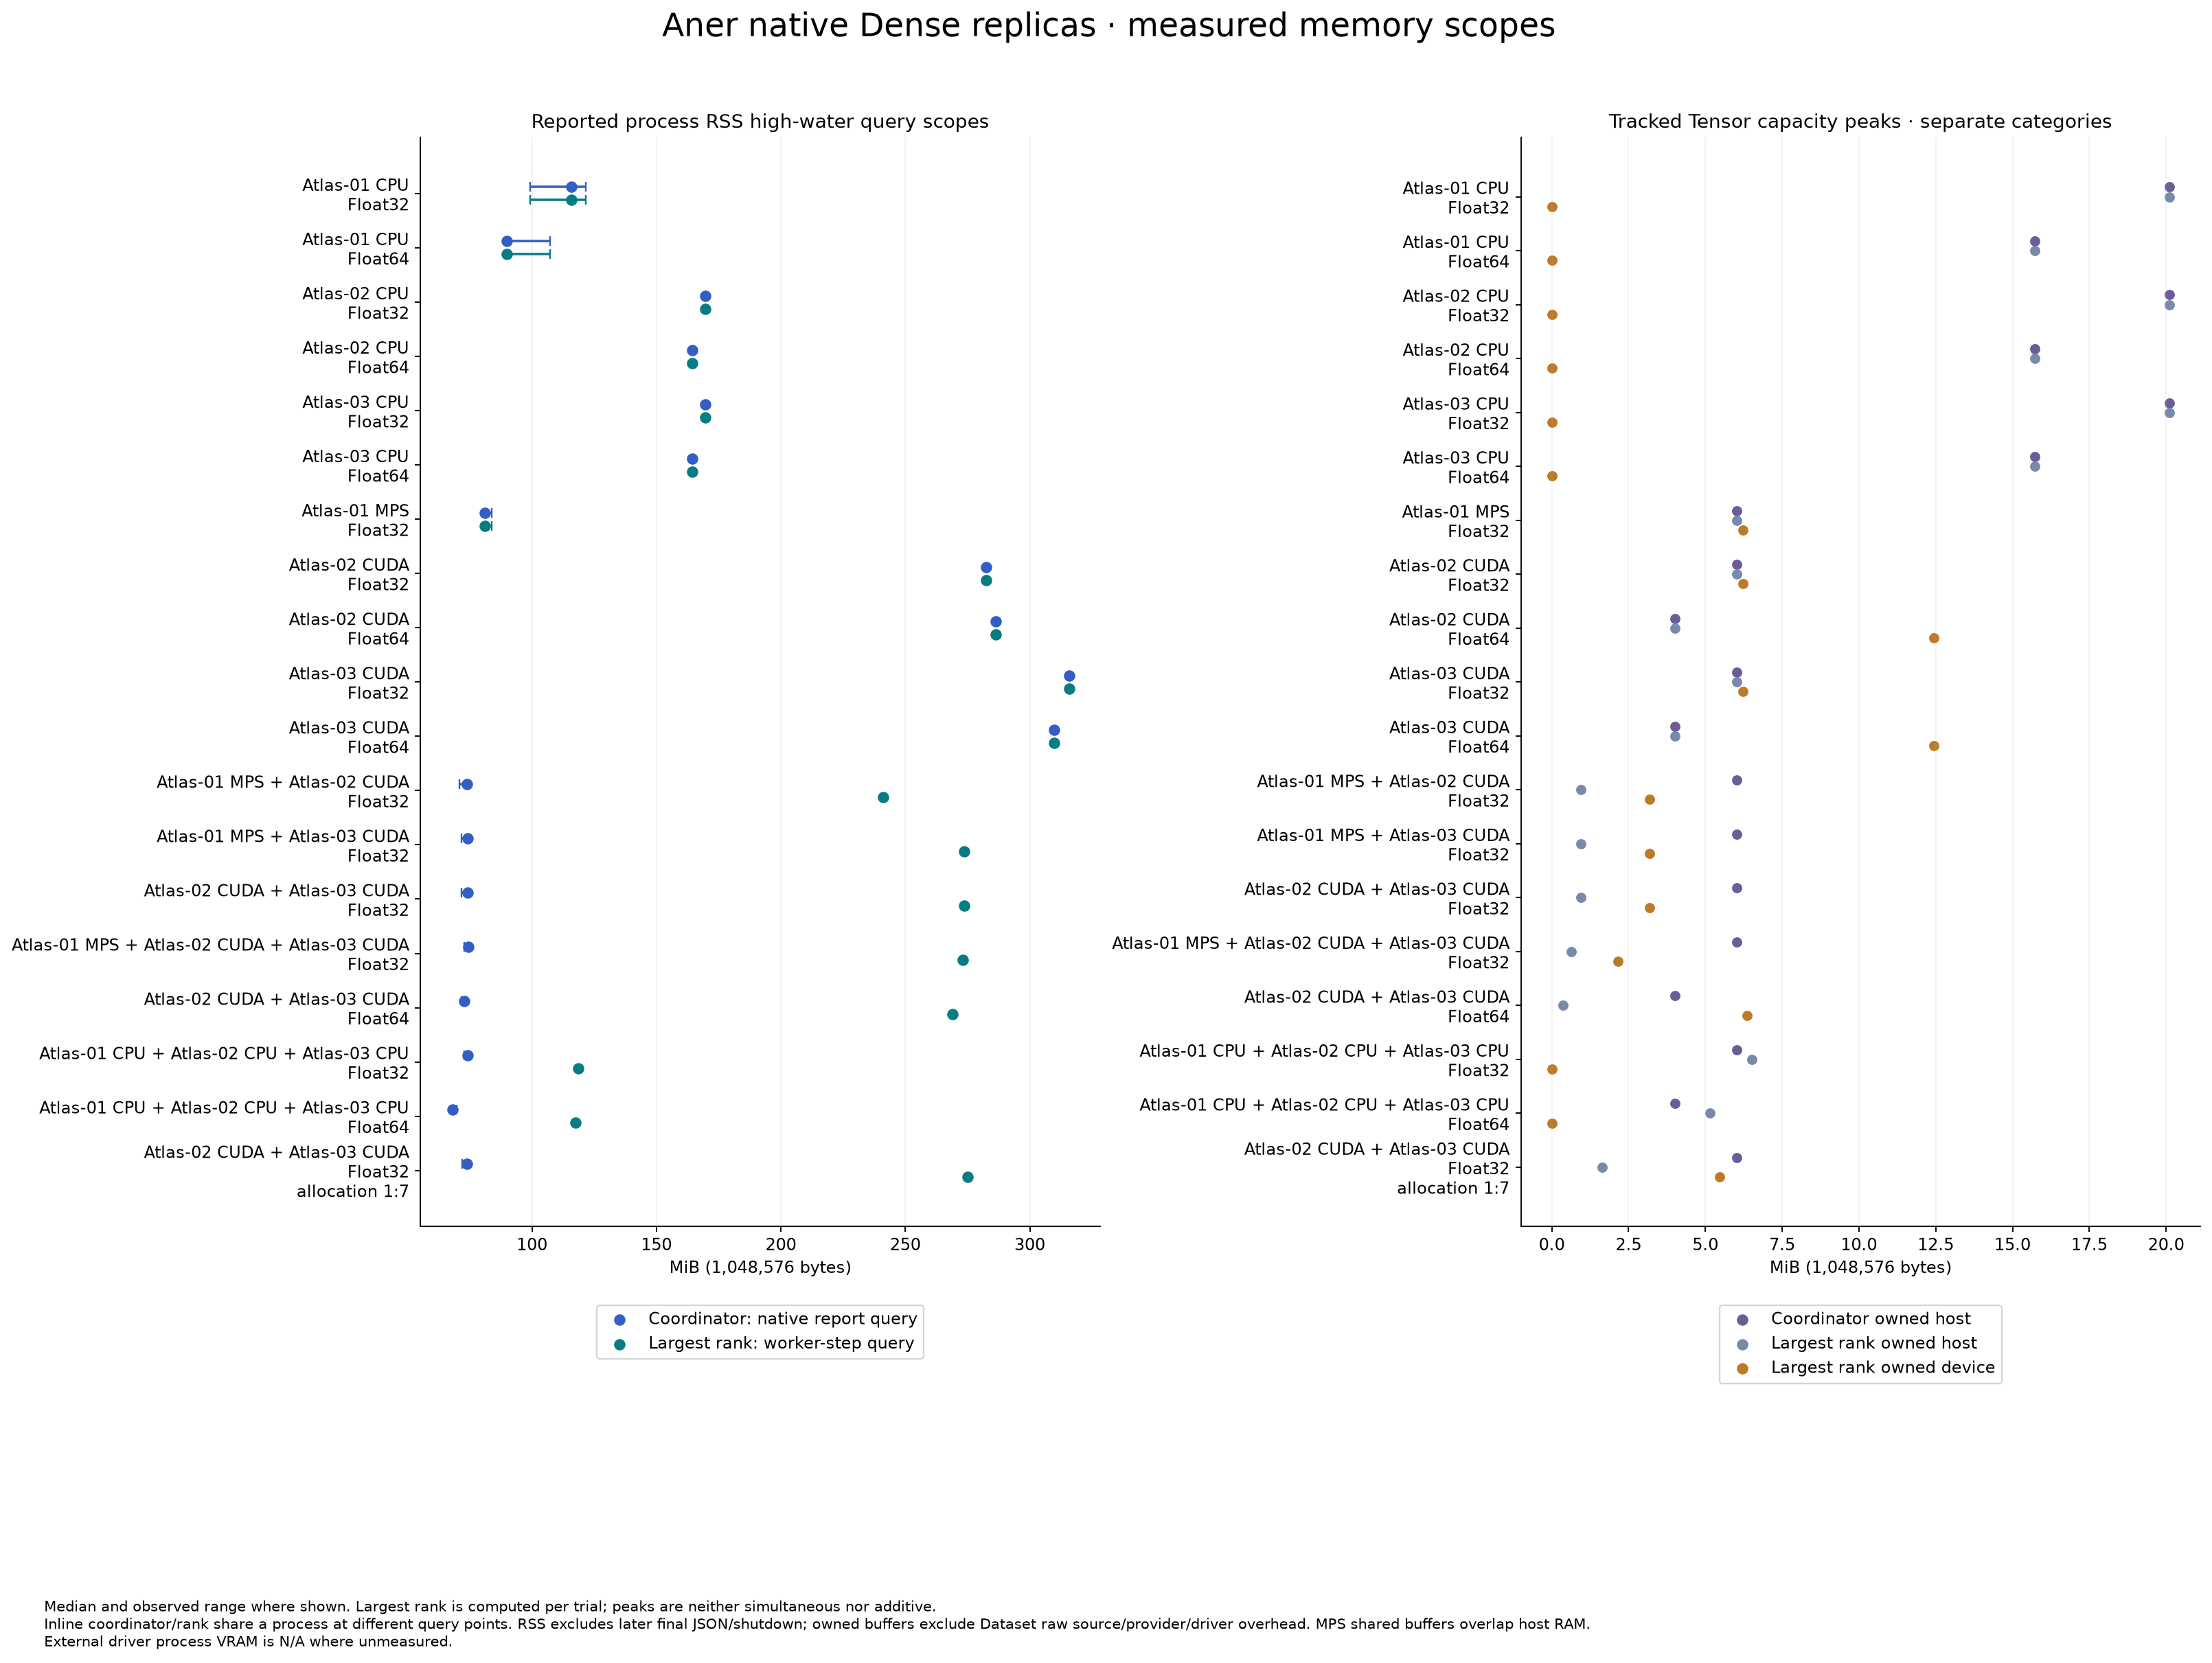
Coordinator RSS is a native high water query before final parameter JSON and shutdown. Worker RSS is queried during accepted gradient steps. Inline coordinator/rank share a process, and those query points differ. The largest rank is selected per trial. Tracked Tensor host/device capacities exclude raw Dataset source, allocator overhead, provider scratch and driver context. Peaks are not simultaneous totals. MPS shared buffers overlap host RAM and must not be added to it. External driver process VRAM remains N/A wherever no PID matched sample was obtained.
Native receipts separately report preparation/upload, forward/backward, readback, worker total duration, request writing, response waiting, payload bytes and coordinator exchange time. Response waiting includes worker computation and transfer; it is not pure network latency. Worker compute is measured with a host steady clock around native forward/backward and completion synchronization, including dispatch/backend work; it is not kernel only GPU event time. Upload/preparation also includes validation, casts and allocations. Worker total time excludes protocol decoding/encoding, checksums and reply delivery. Payload bytes exclude protocol/SSH framing. Request parameter/feature/target values use the selected Float32 or Float64 encoding; detached gradient sum replies use Float64. Metadata and decoded host exchange storage retain their own fixed scopes, so compute dtype alone does not halve all communicated or host staged bytes. Effective link bandwidth, physical host dedication, CPU/GPU utilization and pure network only latency were not measured and are unavailable.
Reproducibility and limits
Download all 57 sanitized trials and 19 excluded warm ups · Download 19 case summaries · Download checksummed public configuration facts
A separate source language correctness exercise used the protected Iris split (90 training, 30 validation and 30 test rows) across the three host execution context. The simple production, development and class based examples agreed: held out accuracy 96.6667% and cross entropy 0.17894501984119415. Development captures identify canonical CPU reference graphs explicitly. These checks verify the source API and modes; their accuracy and timings are not synthetic fixture benchmark results.
The records preserve every same dtype comparison, actual per rank counts/placement, source and partition fingerprints, measured phase/resource scopes, selected baselines and immutable configuration IDs. Private SSH routes, local paths, PIDs and complete parameter vectors are excluded.
This portable path rebuilds local native graphs and stages supported parameter/batch buffers each update. Every replica holds a complete model; memory is not pooled. Direct CUDA collectives, multi GPU per node selection, model/optimizer sharding, convolutional/recurrent models and durable distributed restart were not measured or implemented by this experiment. The synthetic teacher is a controlled numerical fixture. Its accuracy is not evidence about a separate real world task or the hardware performance ceiling.